There is only one type of traffic that we truly welcome here at TONIC. And that’s site traffic. We exist to give you an elevated website. But even more than that, we exist to give you a website that works. What works and doesn’t work on the worldwide web, well, that’s a numbers game. And the numbers are found in Google Analytics. Utilizing Google Analytics will help you answer the question of who your site is reaching and their behavior once they land on your site, too.
Maybe you’re like, “um, ya, don’t have that installed,” or maybe you do have it installed, but you’re unsure of how to decode the dashboard. If you’re in either camp, this post is for you. In this three-part post, we’re breaking down how to install Google Analytics, the key terms you need to know, and how to decode the dashboard. Let’s take a deep dive into Google Analytics so you can sit in traffic that’s actually useful for once. You in?
If you already have Google Analytics installed, skip down to this section! But for those of you just getting started, first, we need to install your Google Analytics tracking ID so it can work its literal magic on your site giving you not traffic information that’s worth its weight in gold for your business.
Create Your Google Analytics Tracking ID
To begin, you need to create a Google Analytics tracking ID. Luckily, Google makes it super simple to sign up for analytics, link your site, and get started. Head over to Google Analytics website and click on “Get Started Today.” Sign in with your Google account, and Google will walk you through the setup process step by step.
Once signed up for Google Analytics, grab your tracking ID which starts with UA- followed by a series of numbers.
Note: If your tracking ID (measurement ID) starts with G- then you created a new Google Analytics 4 account, which is the most up-to-date version!! Showit will allow you to add your measurement ID in this new format. If you’ve previously created your Google Analytics account, you likely have a legacy analytics account. If you’re not seeing that G in your tracking ID, follow these steps instead.
Add Google Analytics Tracking ID to Showit
Once you have your tracking ID, the next step is to add that ID to Showit so Google Analytics can begin to compile your site traffic data. As with everything Showit, they make it very easy to do so!
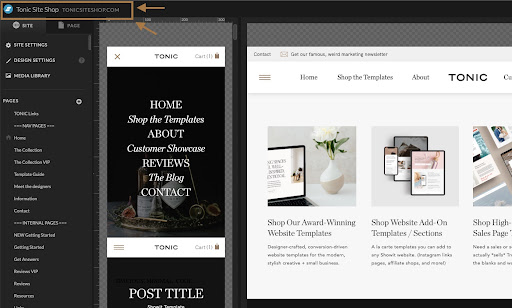
First, log into Showit and select the website you’d like to add your Google Analytics tracking ID to.
Click on your site’s title in the top left corner of Showit’s app to see your “Site Settings.”
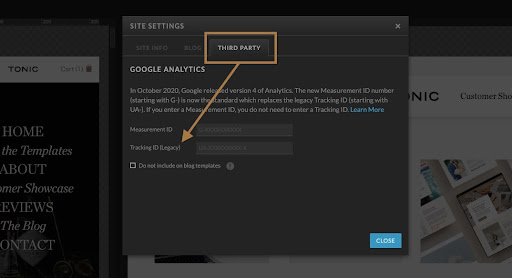
To install Google Analytics in Showit, click on the “Third Party”’ tab in Showit’s site settings and add your Google Analytics tracking ID and/or measurement ID. Click save and then publish your site!
Key Terms to Understand as You Look at Google Analytics
When you do click back into your Analytics dashboard, it can be natural to see all the data streams and immediately want to back out. Trust us, we have been there with our analytics and SEO. Like when Ryan, our SEO guru, told us we were ranking for Greyhound buses instead of, you know, our Greyhound website design after looking into our SEO for about one minute. Don’t be like us. Don’t avoid the data. Instead, know that you really only need to look at the “Home Page” of your dashboard to decipher who your site is reaching and what they’re doing on your site when they arrive. Cheers to that, right! (& avoiding those looking to hop a midnight bus ride to Albuquerque altogether.)
To keep it simple, we compiled a few of the key terms you want to look at and what they mean with the dashboard to empower you to understand what each metric displays. (Want the visual guide? Click here!)
Users: Number of people who have visited your site at least once.
New Users: Number of first-time users during the selected date range in Google Analytics.
Sessions: A session is recorded when a user lands on your website. Let’s say someone returns to your website the next day, google will record another session. One user can create multiple sessions. This is why sessions can be a higher number than Users/New Users.
Pageviews: A pageview is recorded when someone lands on a page of your website. If someone visits your home, about, and contact page all in the same session, Google will record one user, one session, and 3 pageviews.
Average Session Duration: Just like it sounds, this records how long people are staying on your website during a session.
Bounce Rate: This is the % of single-page sessions in which there was no interaction with the page (no clicking around). The lower your bounce rate the better. We want people to click around and dive deeper into our website.
Traffic Channels: Channels are how or where people are entering your website. Google will record where people are coming from when they land on your website and categorize them into channels like direct, referral, organic search, social, email, and paid search. This is handy when you want to know if your SEO efforts are paying off, or if people are finding you via social media.
For extra measure, here are the specifics on the various channels displayed:
- Direct: Traffic from someone typing your domain in their browser.
- Referral: Traffic from a website (not a search engine like Google) linking to your website.
- Organic Search: Traffic from search engines like Google, Bing, etc.
- Social: Traffic from social media like Instagram, Pinterest, and Facebook.
- Email: Traffic from an email newsletter.
- Paid Search: Traffic from ads inside of a search engine.
- Note: There may be additional channels that you see, and a quick google search can help you find out more about that channel!
Are you feeling better already? We hope so. While the word “analytics” sounds intimidating, the above terms break down that intimidation piece by piece so you can figure out what’s totally working for you and what’s not when it comes to your website. To discover that very fact… enter: Your Dashboard.
What To Look For In Your Google Analytics Dashboard
If you made it to this point in the post, well, then you’ve come SO far, and we love to celebrate small steps of progress!
Install your Google Analytics Tracking ID. ✔️
Learn and understand the key terms when you peek at Google Analytics. ✔️
Since you’re already slaying this Google Analytics to-do list, let’s bring it home, shall we?
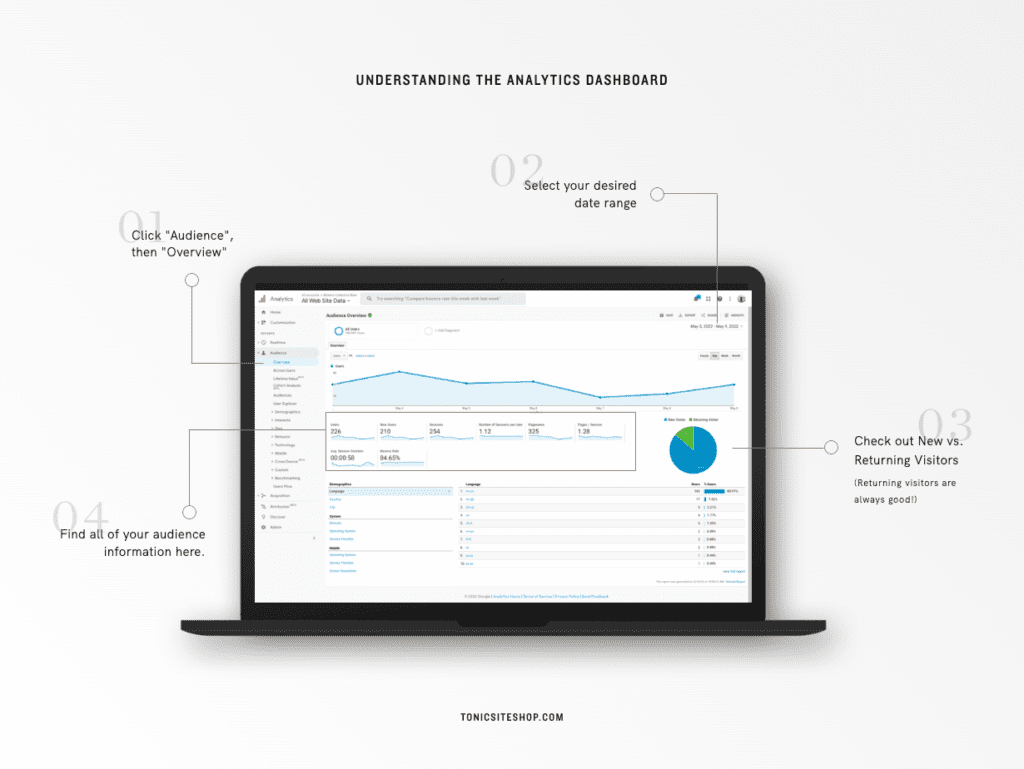
The “Home Page” of your dashboard is where you want to live because that’s where all of this data comes together. Again, while there are several ways you can get into the real nitty-gritty of your site’s traffic data, to see who your site is reaching and what they do when they hit your site, we will keep this very straightforward.
Step 1 – Set a Date Range
Set your date range for your desired time. Typically, a good range is set for the past 30 days or 90 days.
Step 2 – Identify Users
Take a look at how many users visited your site and the average time they spent once on your website. If your average session duration is really low, let’s say less than a minute, then you know you will need to make sure that you have enough information on your website to keep people interested for a longer duration! People will tend to stick around if you offer tons of quality info that is easy to find. If they’re dipping out early, brainstorm what valuable information you can add to your homepage that would make them keep reading.
Step 3 – What are they doing on your website?
To see what your users are up to when they land on your site, take a look at your bounce rate. If your bounce rate is really high, it’s an indicator that people aren’t really interested in clicking around on your website, or there is no clear Call to Action (CTA) that encourages them to click on to the next page of your site. To combat a high bounce rate, be sure you have clear CTAs at the bottom of each page. Never leave them hanging. Instead, ask a question that leads to the next page of information you want them to explore — and then make sure it’s linked via your Click Actions.
Step 4 – Take a Look at Your Top Pages
It’s important to look at your top-performing pages. If you see a blog post that gets a lot of traffic, then you know that post is doing something right! Take a look at that post and see what makes it different from other posts that aren’t performing as well. You can repeat this with your website pages to identify which are working (indicated by the performance), and then why they’re performing better than others. Tweak your lower-performing pages and check back in 30-90 days to see if there is any change.
Step 5 – Are Users Viewing Your Site on Desktops (and Laptops) or Mobile Devices?
Often overlooked: the device in which most users favor viewing your site. Identify if most users view your site on desktop (or laptops) vs. mobile devices. From a design standpoint, knowing this critical piece of information will enable you to tailor your User Experience (or UX, if we want to sound like you’ve spent any amount of time in Silicon Valley!), to the device that the majority of users view it on. If that’s mobile, for example, you can focus on the design direction and experience for mobile users as opposed to someone viewing your site on a desktop. While both views need to be user-friendly, you can really lean into the favored device — once you know how people are most prone to view and use your site.
And to think: you can learn all of this without ever leaving your “Home Page” in Google Analytics! Equipped with the power of data, you can identify who is using your site, potential areas for performance improvement, and information on how to better the user experience, too. Data drives decisions. And when it comes to your business and website, you can make better-informed decisions, based on the data found in your Google Analytics dashboard. These seemingly small observations can help you to capitalize on what’s working for you (or correct what’s falling flat!) as you continue to grow or scale your business.
So, on a scale of 1-10, how do you feel about data now?
Did we convince you that it’s not only powerful BUT easy to evaluate? Data doesn’t have to be overwhelming. It’s informative. Let’s empower our businesses and take the necessary steps to set ourselves up to see WHO is actually using your site and how to make adjustments driven by purpose!
If you have questions about Google Analytics, comment below or shoot us an email! Some of our favorite emails we receive are testimonials that include actual numbers from your Google Analytics dashboard. We want you to be the next one boasting about your Bounce Rate that dropped wayyyy down, like Cassie here:
“My traffic has jumped, visitors are spending over 25% more time on my site, my bounce rates have dropped, my email list has grown by 12% and my inquiries have skyrocketed.”
Cassie
And while that line may not get you a date on your dating app, just know that Team TONIC will celebrate that with you any day of the week!